Air Quality Monitor Reviews Temtop S1+ Review – The Most Affordable Portable Air Quality Monitor
For quite a while, the air quality monitors that have interested me the most have been portable devices. Not just because I think they can often be more useful but also because it feels like they’re much rarer than their indoor and outdoor mounted counterparts. Off the top of my head, I could probably barely name five portable (consumer-grade) air quality monitors. On the other hand, I am sure I could quickly list 50 indoor and outdoor air quality monitors.
Anyway, before I get too off-topic, this explains my excitement when Temtop recently reached out asking me to review another one of its devices. Until a few months ago, I had only heard of Temtop but had no hands-on experience with the device. However, after reviewing the Temtop M10+ a few months ago, I quickly understood why these air quality monitors are quite popular. While the M10+ was a solid device (and you can read my full review if you’re interested in learning more), it’s fair to say that I’m much more excited about the potential of the Temtop S1+.
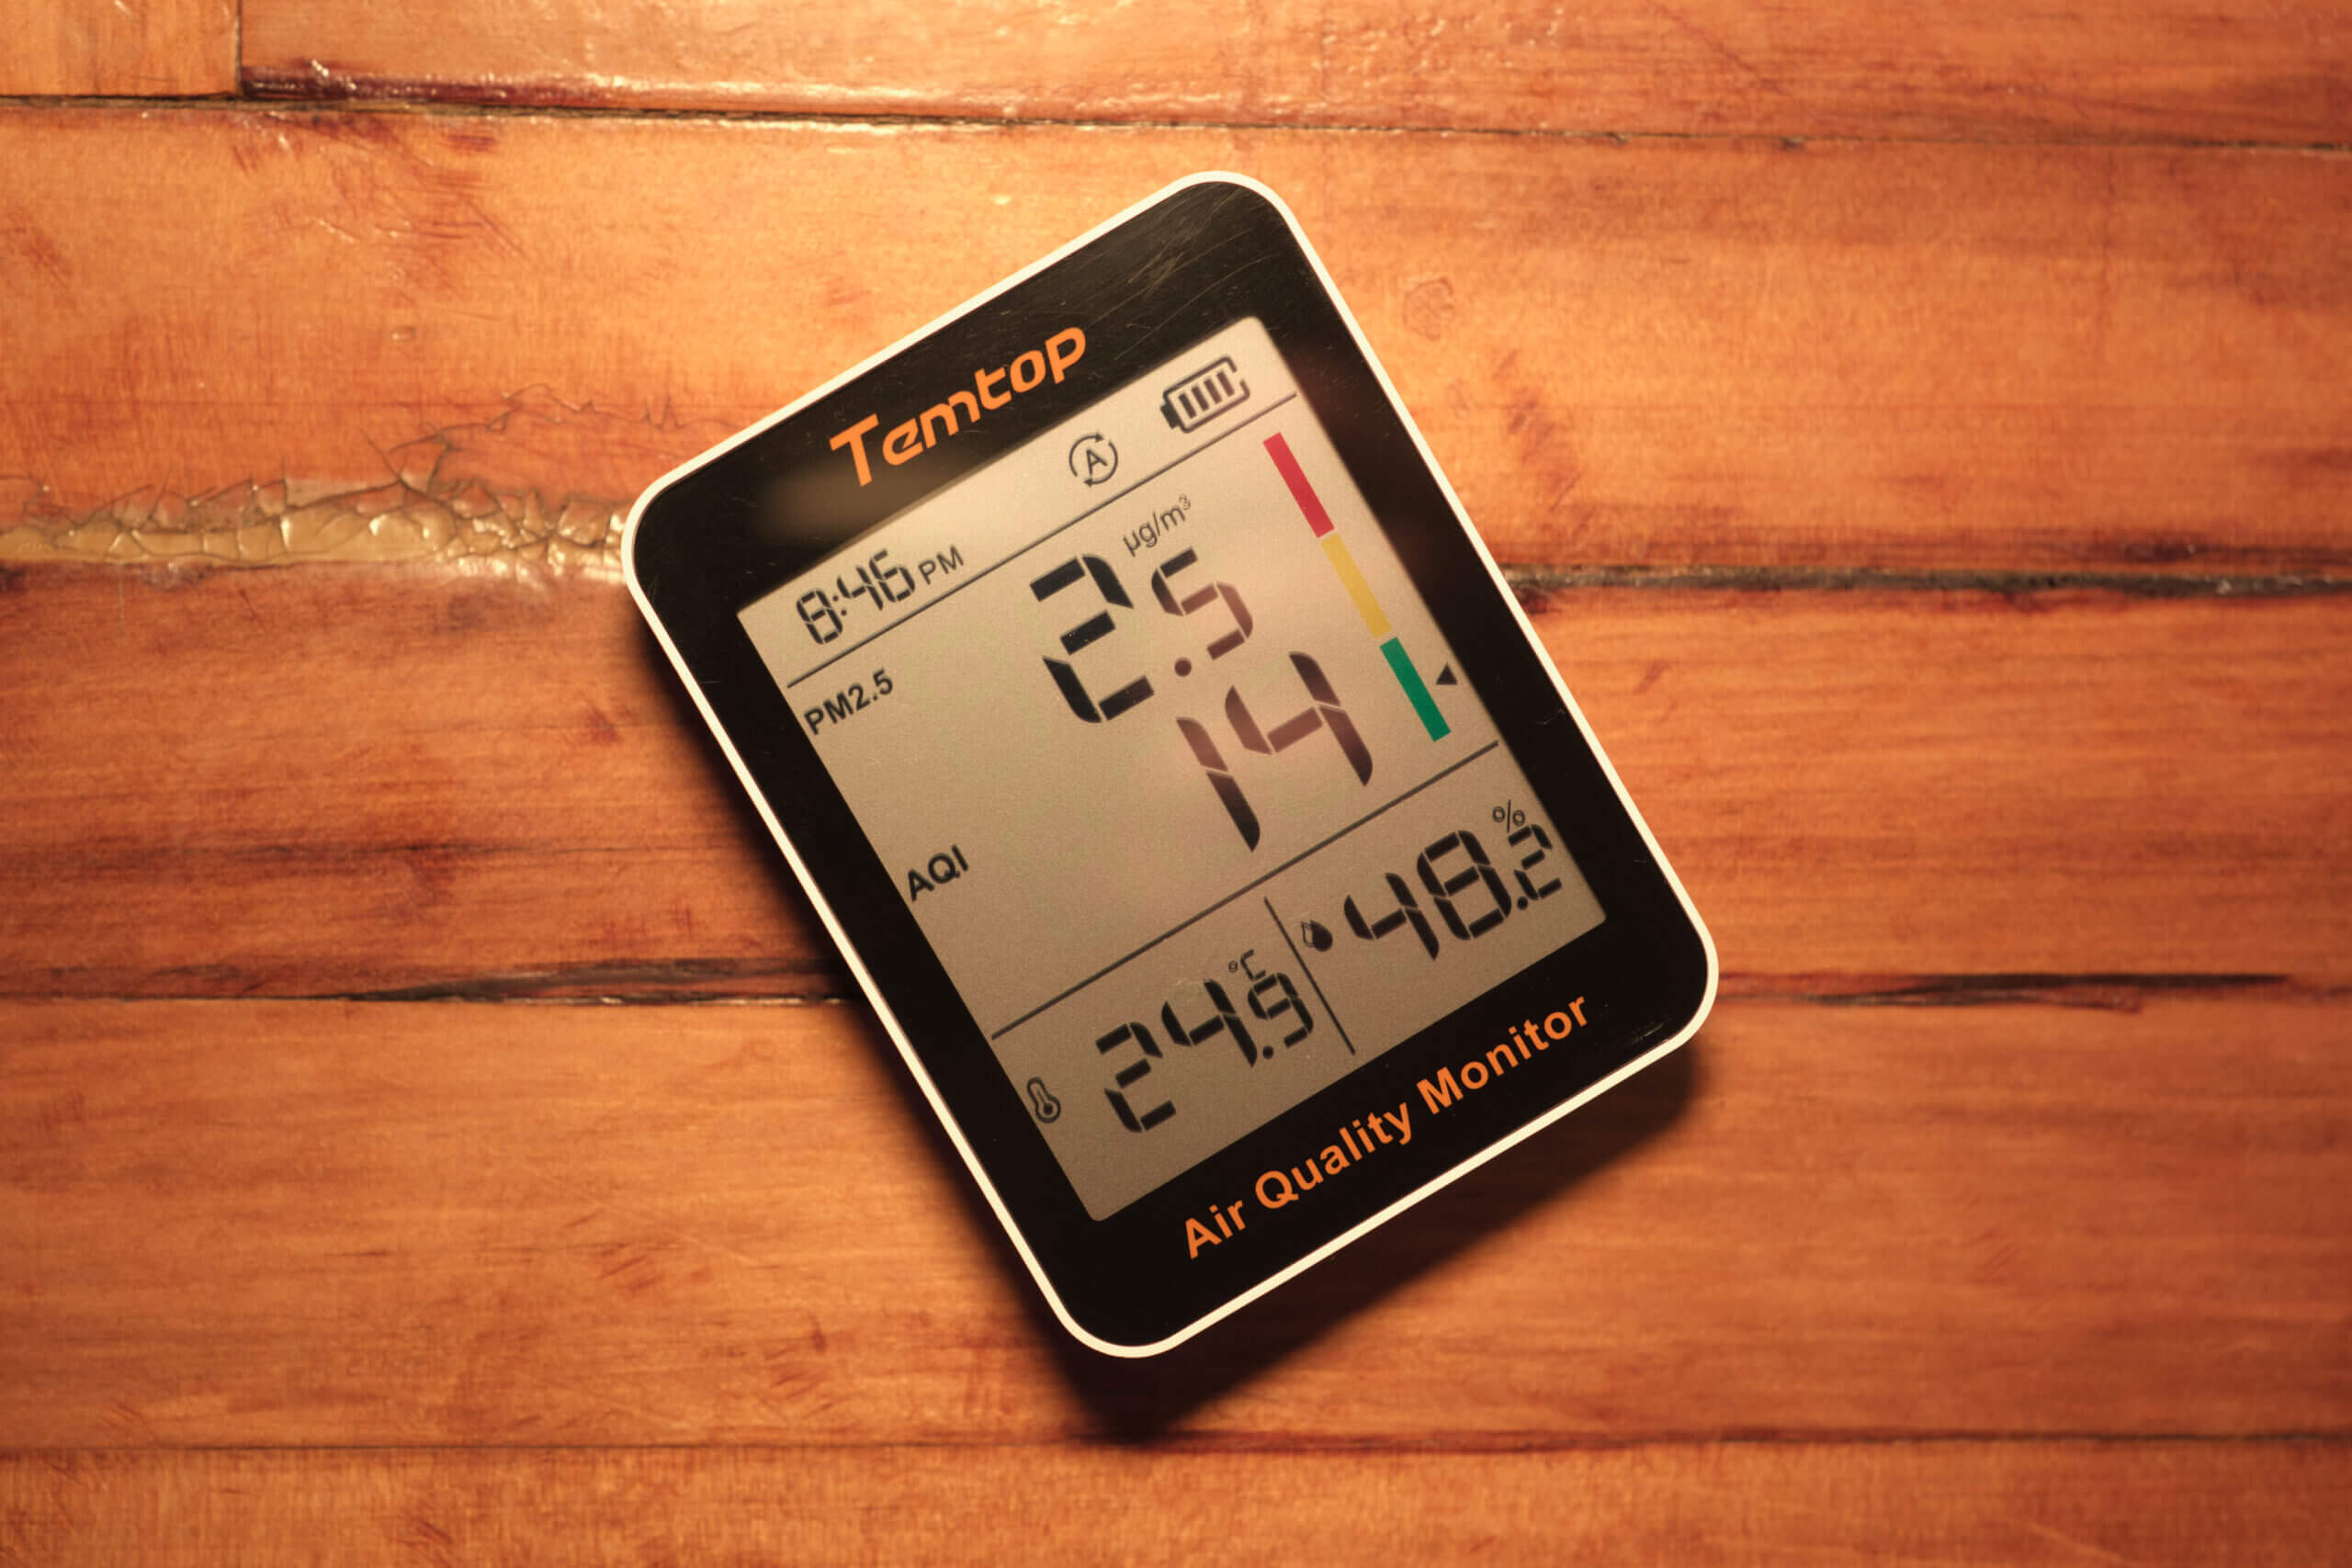
So, what exactly is the S1+? Well, it’s a low-cost, portable air quality monitor that measures PM2.5, temperature and relative humidity. It also shows AQI, but this is not a sensor and is instead a value on an index acquired by knowing the PM2.5. It’s also worth noting that it’s not a full U.S. EPA AQI (based on many pollutants) but only an AQI based on PM2.5. Either way, portable PM2.5 monitors are relatively few and far between; therefore, I was intrigued by the S1+ – especially at such an affordable price.
I’ve been using the S1+ for about a month now and look forward to sharing my thoughts on the device. Over this month, I’ve used it in a range of situations – both in my home and while out and about – and I’ve also compared it to a range of other air quality monitors. If you want to learn more about this device, please read on! I’ll do my best to cover all pertinent aspects of the device and answer any questions you may have about it.
Accuracy

One of the most interesting aspects of Temtop is that it creates its own PM sensors. While this might sound obvious, anyone familiar with air quality monitors will know that most sensors come from a few manufacturers. For example, AirGradient, PurpleAir and AirBeam all use Plantower sensors. On the other hand, AirThings and Air-Q rely on Cubic sensors. This makes a company that creates its own sensor technology quite unique. The only other company that comes to mind is IQAir, which has the AirVisual Pro monitor. Of course, this also often means the sensors tend to be less researched than their more widespread counterparts.
Since the Temtop S1+ only has a particle (PM2.5) sensor inside, my job is easy this time around. Unfortunately, to make it a little bit harder, no third-party testing organisations like AIRLAB, AQMD, or Afri-SET have examined any of the ‘consumer-grade’ Temtop sensors. With that said, AQMD has examined the Temtop LKC-1000S+ as part of its AQ-SPEC program, and the device performed very well in regard to PM2.5 correlation with reference-grade monitors.
While admittedly a more professional monitor, the good results of the Temtop LKC-1000S+ show that Temtop can develop good sensors. This is especially important in the case of this company, as its sensors are made in-house, and these results bring some trustworthiness to the brand. With that said, the consumer-grade monitors from Temtop, like the M10+ and S1+, use different sensors, and it will be interesting to see third-party tests of these sensors if they’re ever released.
Before doing any of my own comparisons, I was curious about the precision of the S1+. Since I only have one other Temtop monitor (the M10+), this is far from a good sample size, but I still wanted to try. I compared PM2.5 readings from the two devices over a couple of days. At both high and low PM2.5 concentrations, these devices exhibited very similar readings, and I was pleasantly surprised by the precision. At very low concentrations, I was surprised to see these two devices even frequently show values within 0.1 of each other. This makes a lot of sense as both monitors use the same sensor technology, just in a different shape (presumable the S1+ sensor has to be smaller to fit into the smaller body of the monitor).
Of course, this doesn’t prove accuracy, but it does show that the inter-device performance is good. The less variance between devices, the better, and while a larger sample size would be ideal, this shows that the sensors can show consistent readings. With this in mind, I want to discuss the device’s modes before looking at some comparisons with other devices.
When plugged in, the S1+ will take a reading every 1.5 seconds. When not plugged in, the monitor will take a reading every three minutes (in A mode) or five times every thirty minutes (in ECO mode). Interestingly, however, is that while ECO mode shows a 30 minute reading, you would assume this is a rolling average. Instead, it’s calculated by an ‘intelligent’ algorithm, and this is the value shown on the screen. While I don’t know how much I trust the ECO mode algorithms (more on this soon), three-minute intervals while on the battery are acceptable, but I wish there were also other options (such as 60 seconds or even 30 seconds). When plugged in, the device provides very frequent updates.
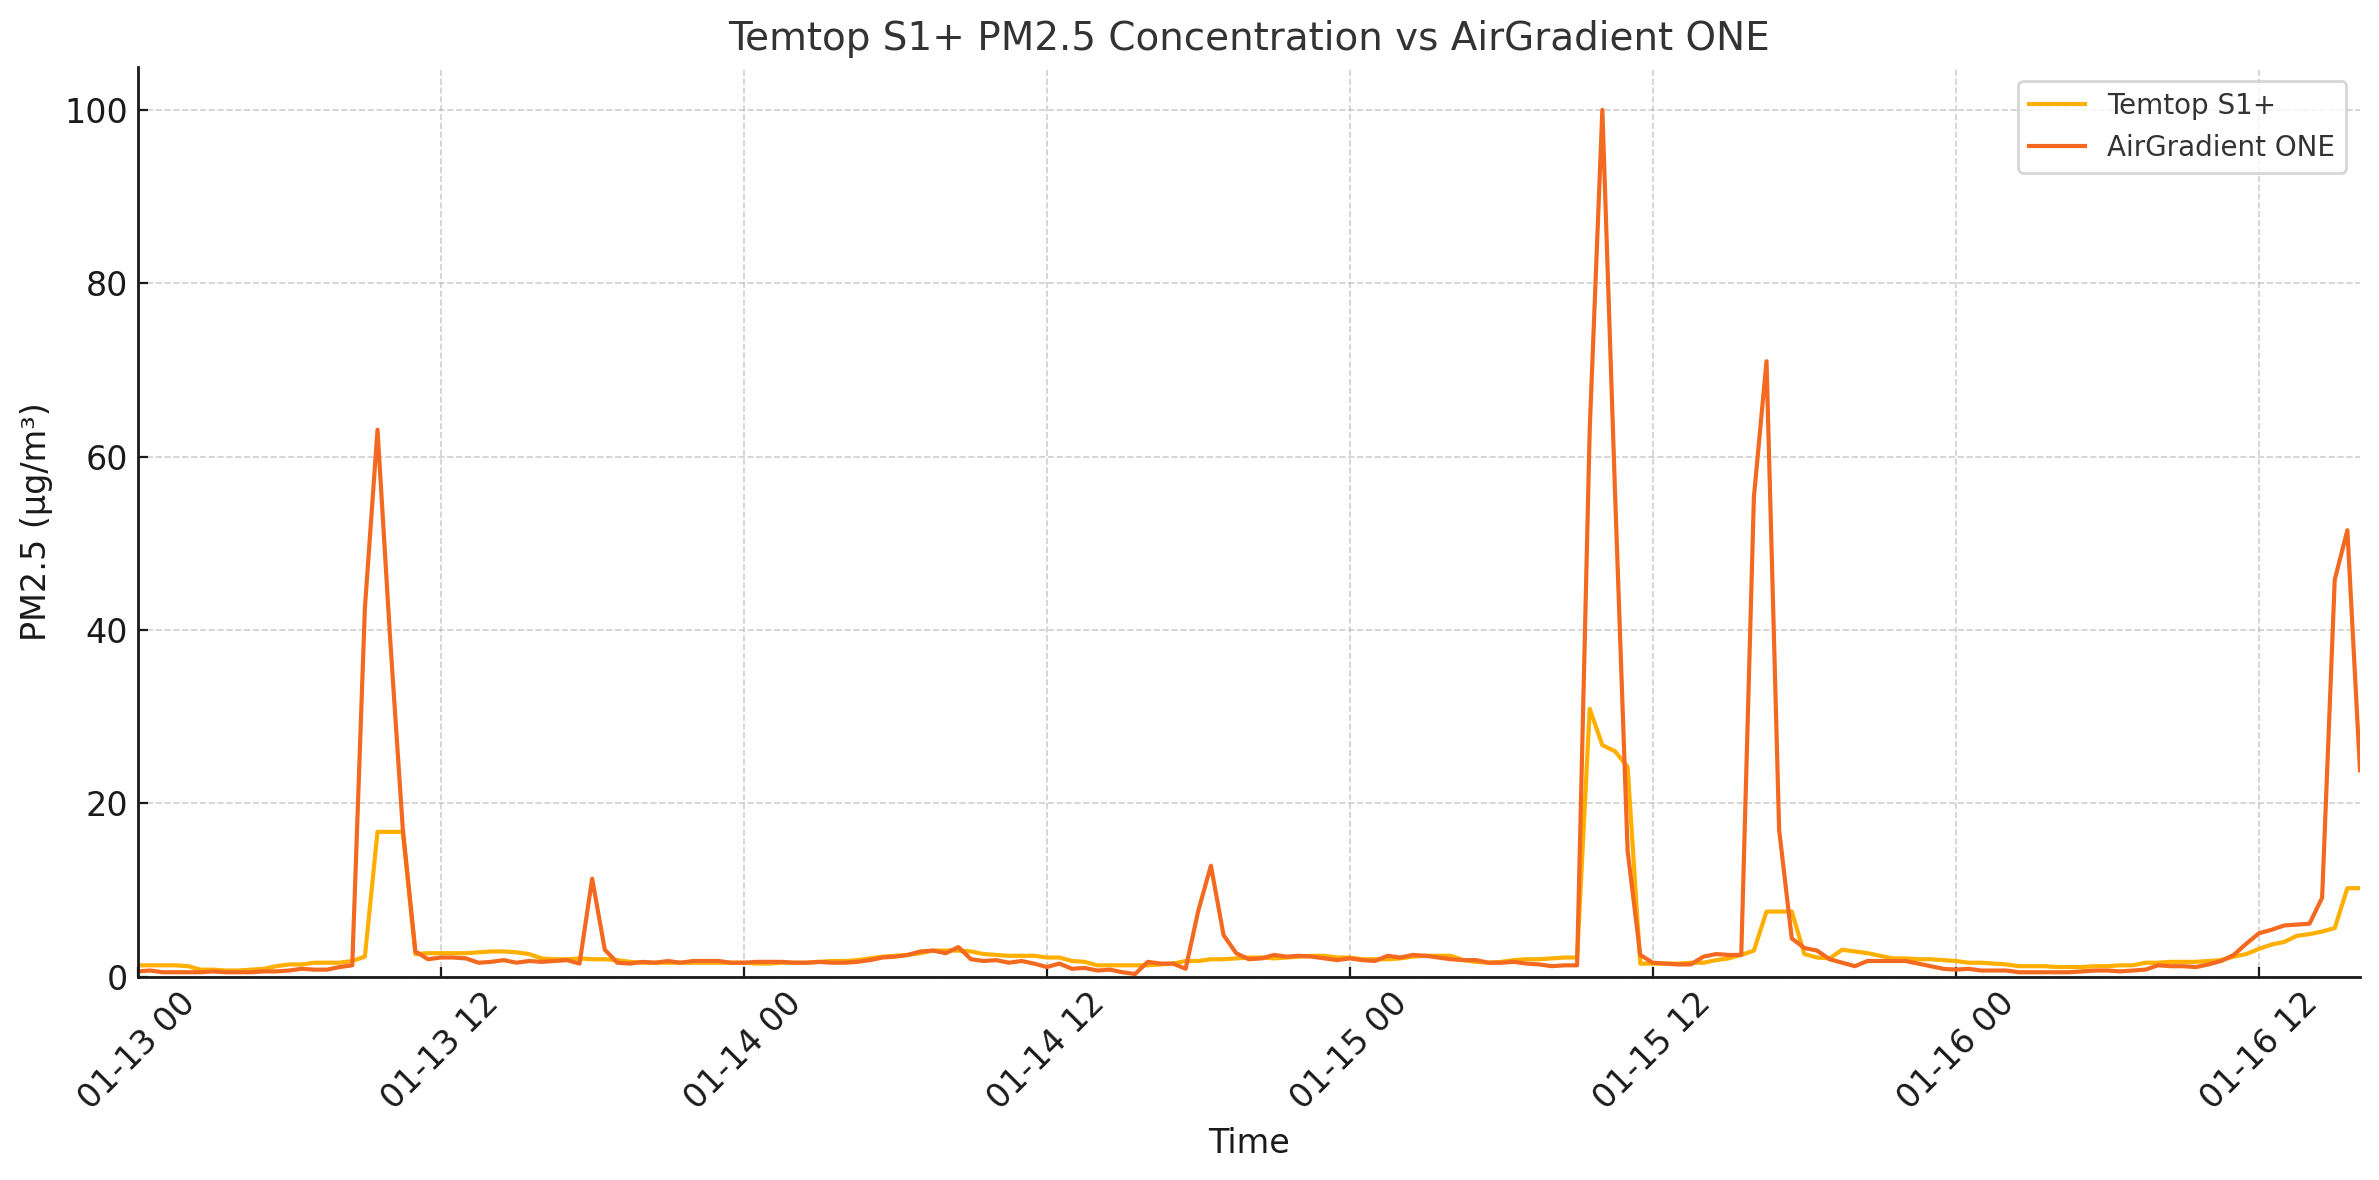
Now, I did want to run some of my own (far from scientific) comparisons with other low-cost air quality monitors, but I honestly couldn’t figure out how to do this very well. This is due to the fact that even when plugged in (and taking a reading every 1.5 seconds), you can only export data from the monitor in 30-minute increments. While this shouldn’t have proven to be a big issue, what made it so difficult is that this exported data isn’t simply an average but, instead, seems also to have some ‘ECO’ algorithm applied to it. Just look at the comparison graph below:

While I expect the AirGradient ONE readings to be higher than the true concentration (the Plantower PMS5003 is known to overreport PM2.5 concentrations at higher values), this is a very big difference and also shows how the S1+ can be slow to respond with ECO mode on (I shifted Temtop data back by one hour for this comparison, as the ECO mode, and, apparently, exported data have a significant lag). As you can see, the S1+ provides far lower peaks than the AirGradient device and, when not edited, with a significant delay.
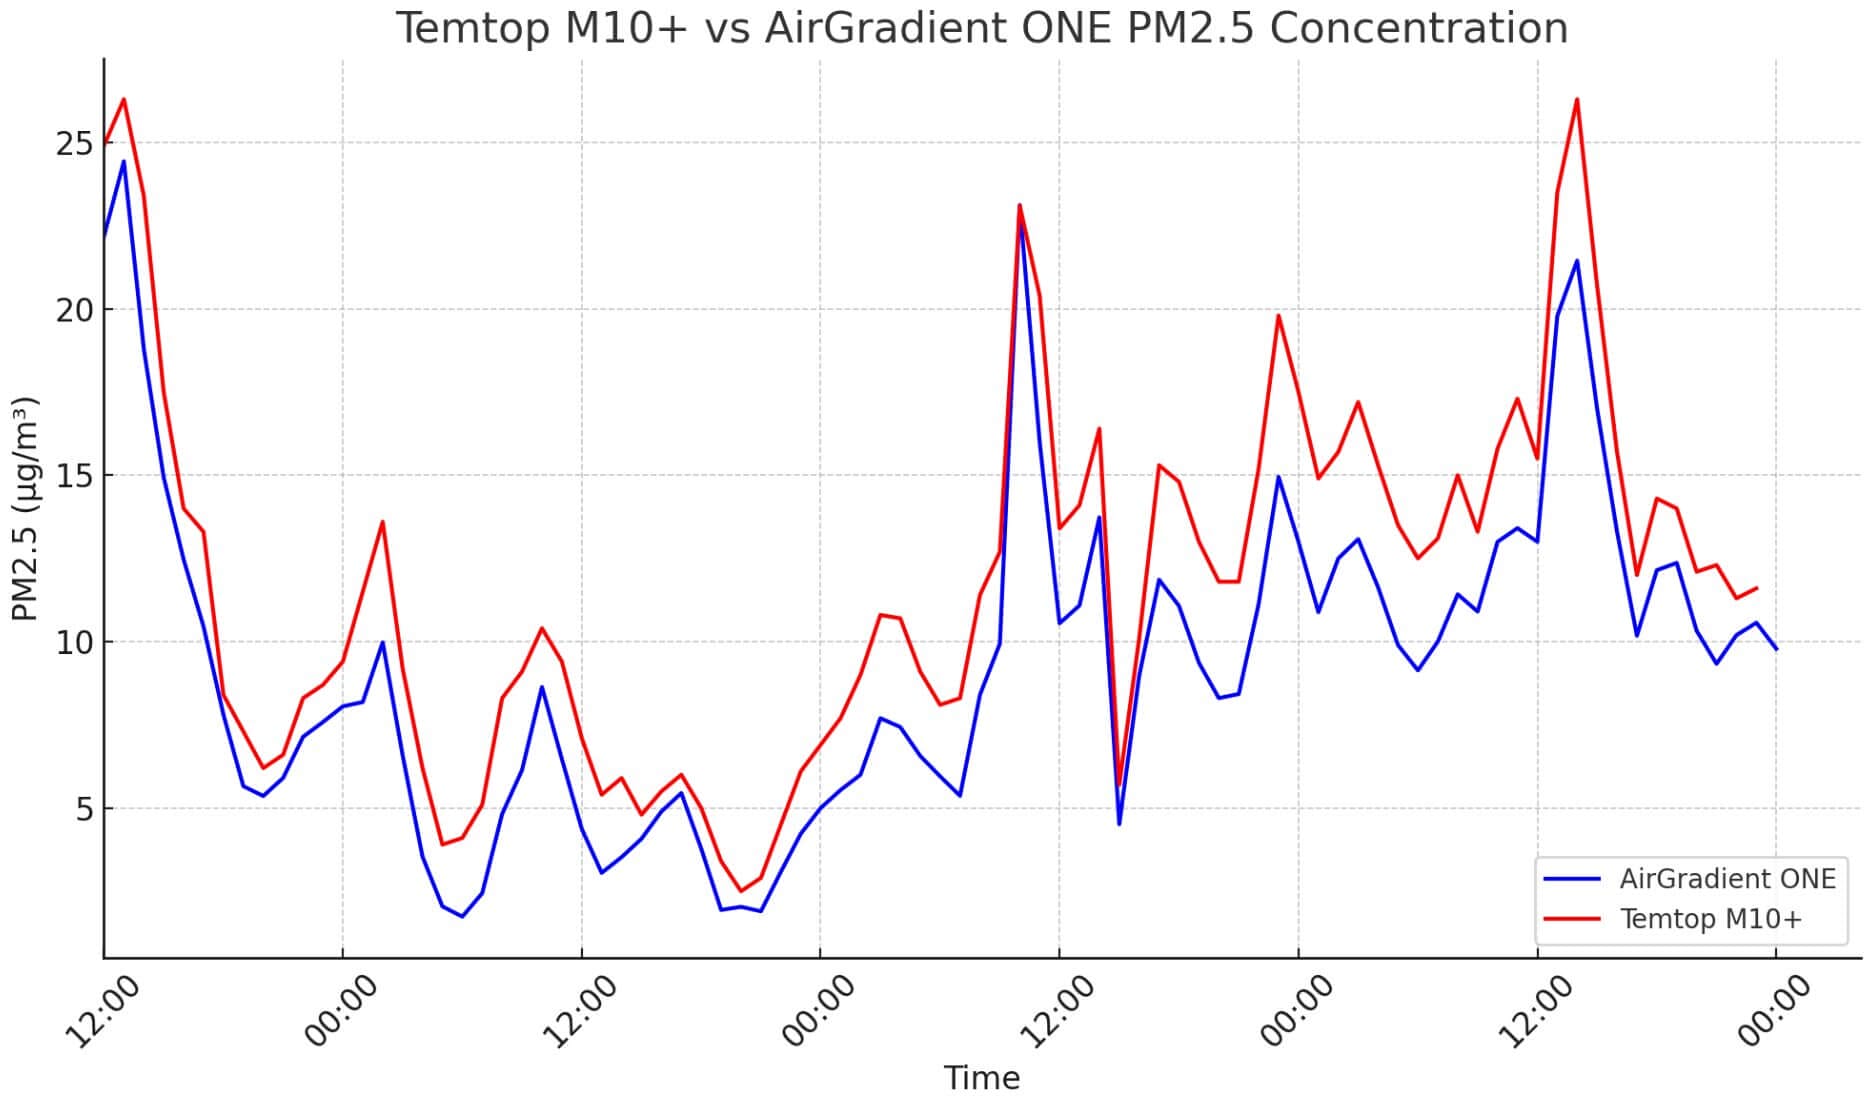
It is worth noting that you won’t see this delay reflected on the measurements on the device’s screen itself (unless you’ve set it to ECO mode), but it does make running any kind of comparison frustrating. I did a similar comparison with the Temtop M10+, and the results followed far more closely. Below, you can see that comparison:

As you can see, the results in this comparison are far closer and more similar to what I would expect – even though the M10+ only exported data in 30-minute intervals too. I tried a lot of things, like applying different algorithms to the AirGradient data (like the EPA and CF=1 corrections), but both of these still led to much higher readings than with the Temtop S1+.
For the first time in any of my articles, I’m having trouble concluding exactly where the Temtop S1+ stands when it comes to accuracy. I do believe the device is accurate because it uses the same sensor technology as the M10+ (which is quite accurate compared to other consumer-grade monitors – see the above graph) and because, anecdotally, whenever I look at the S1+ next to my AirGradient and PurpleAir devices, they report quite similar concentrations.
At the same time, when I actually export the data from this device, it’s clearly being adjusted in a way that I don’t quite understand. I wish that either the export function would show every reading from the device, give an average over the set period (in this case, 30 minutes), or that the weighting method was explained somewhere. Even after some communication with Temtop, I’m a bit lost. Anyway, if I had to give a personal note, I would say the accuracy looks to be decent, but there needs to be more transparency with the device.

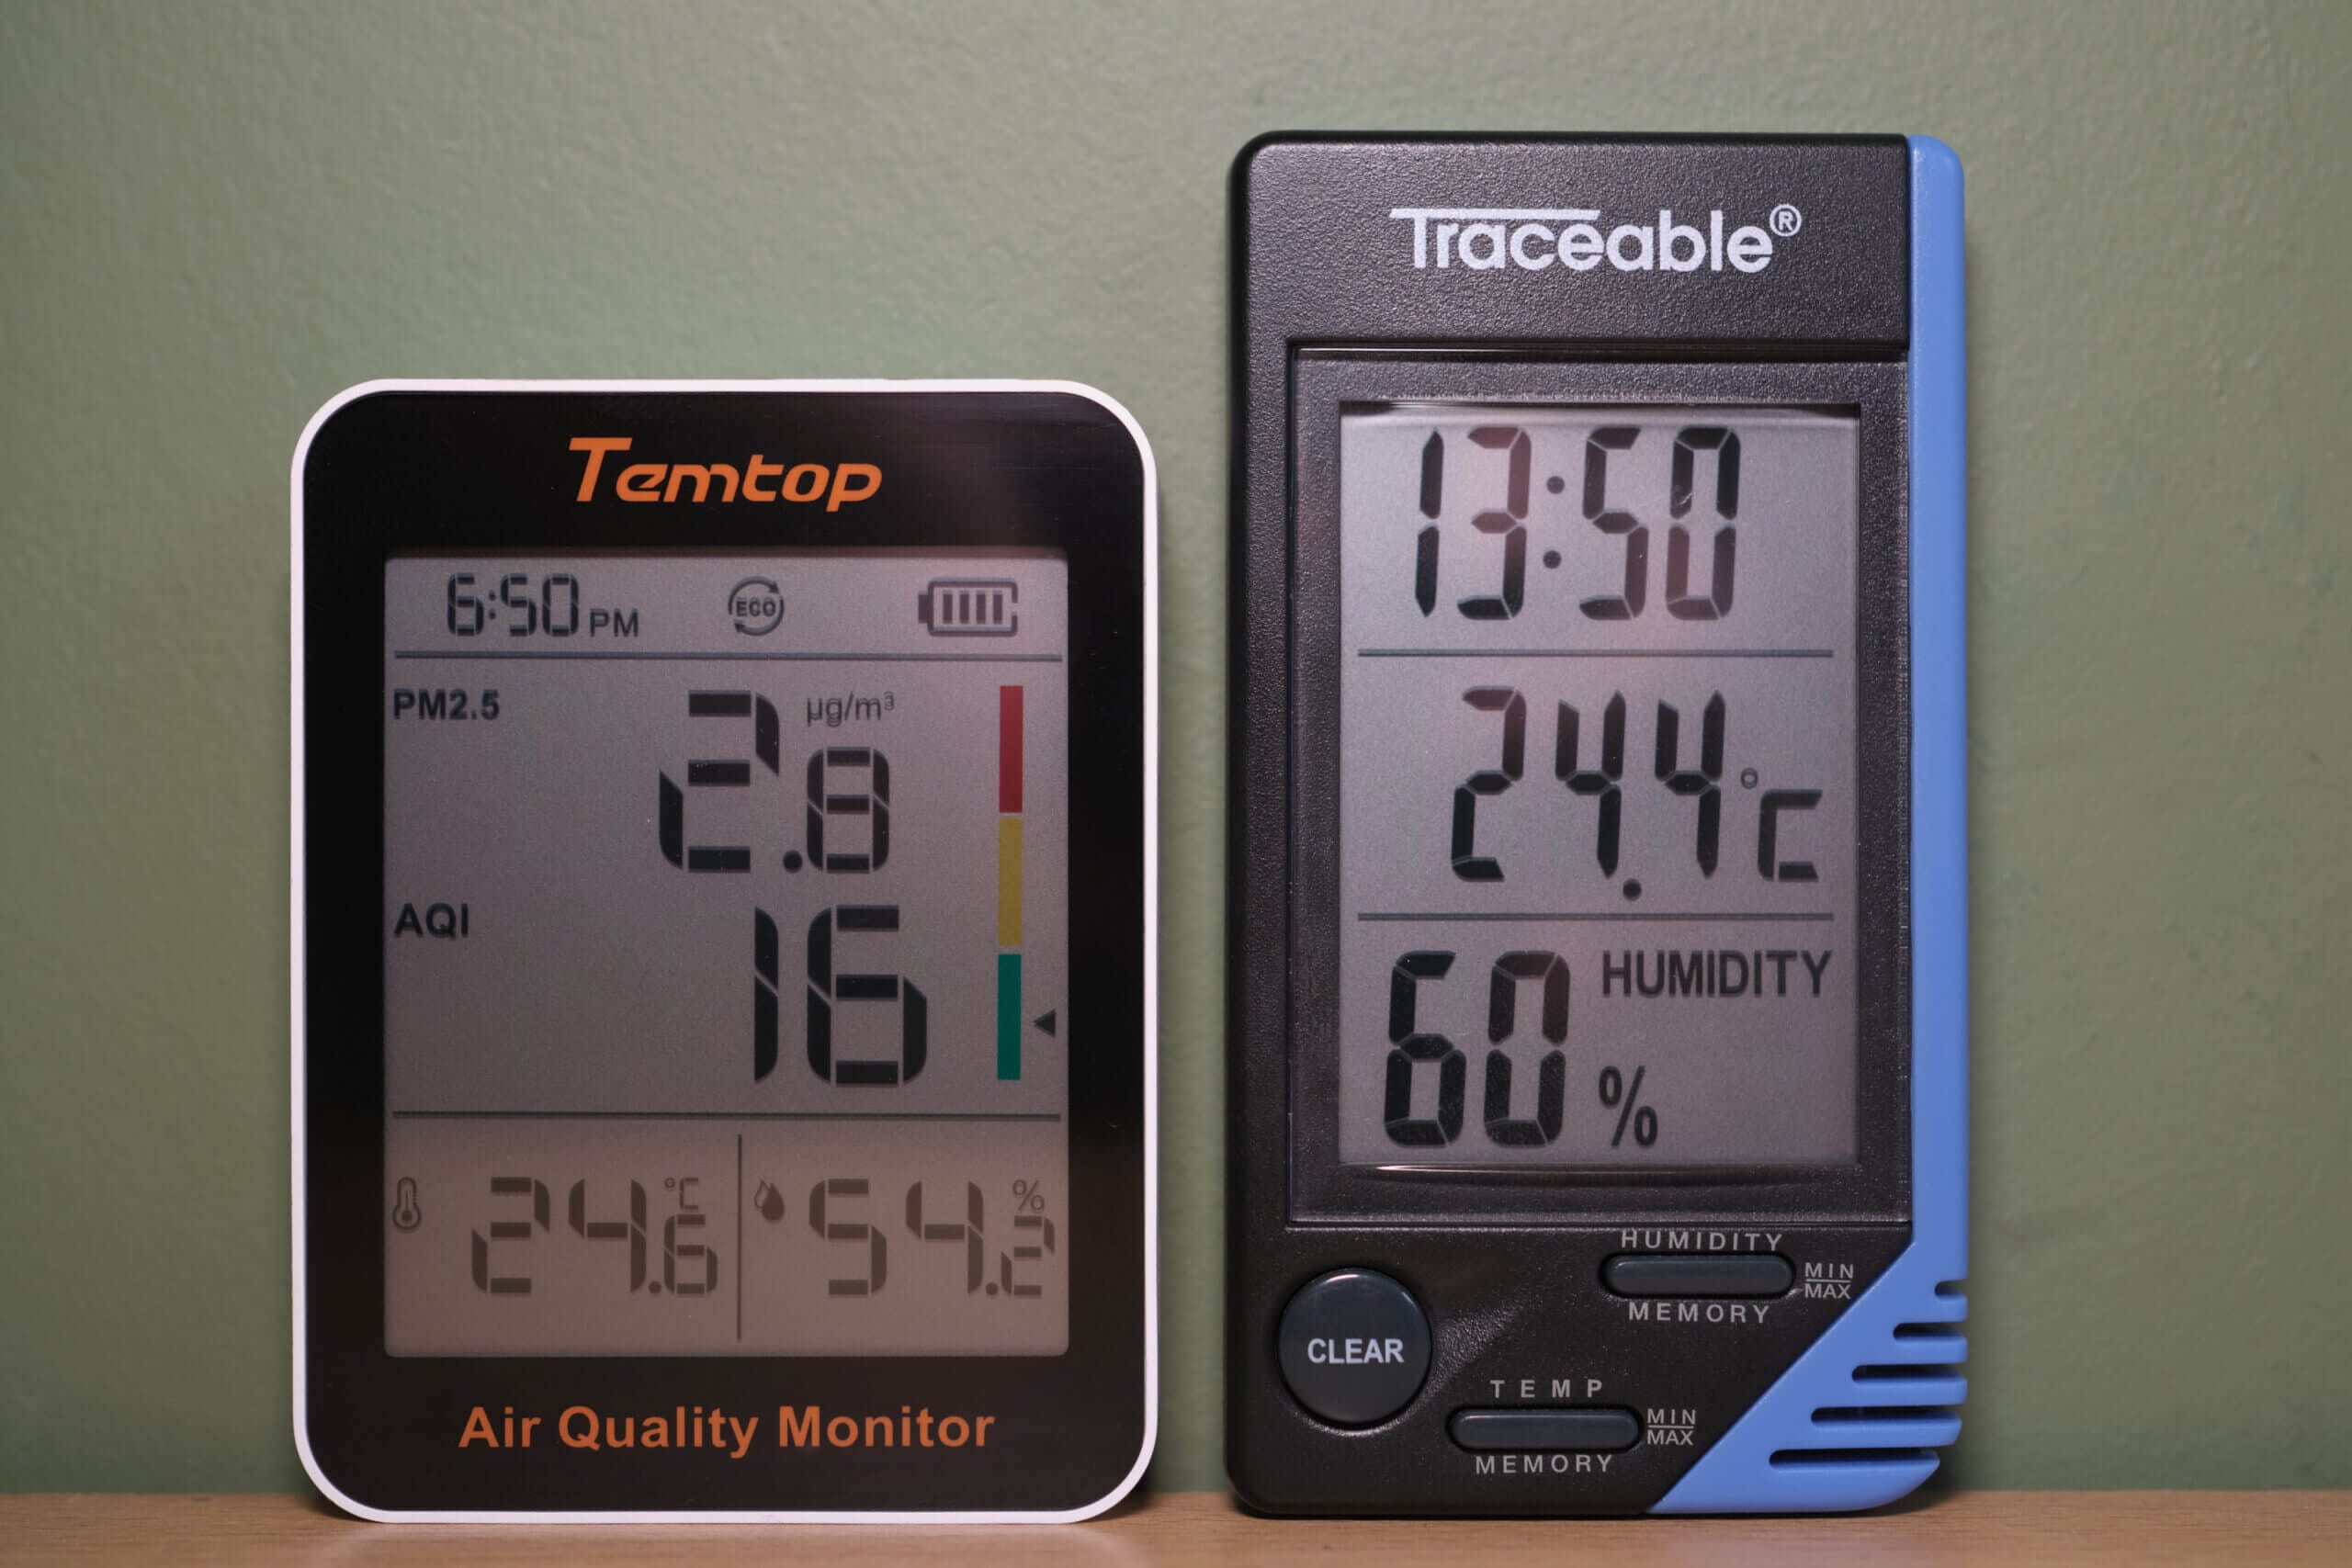
The Temtop S1+ also monitors temperature and relative humidity, and I wanted to see if these values were accurate. Not only can they be misleading if incorrect, but if Temtop uses either measurement in correction algorithms for PM2.5, it’s important they are at least somewhat accurate. Luckily, from what I was able to test, both temperature and RH values are surprisingly good – at least when the device is battery-powered.
Compared to my Traceable monitor, which has been lab-tested and proven to be very accurate at around 50% RH and 25°C (with decreasing accuracy as RH increases and decreases), I’ve found the S1+ to almost always provide very similar values. As I am writing this, my S1+ reads 23.5°C and 51% RH, whereas my Traceable monitor reads 23.5°C and 52% RH. While they don’t always read as closely as they are in this example, I’ve never seen the two deviate by more than 3% RH and .5°C.
Of course, it’s important to note that as relative humidity increases, the accuracy of both devices will drop. Therefore, if you live in more extreme conditions, you might want to run your own comparisons if possible. While I would love to do this myself, I don’t have a good device for testing the accuracy at higher humidities as even the Traceable monitor can become quite inaccurate at more extreme values.
This article was reposted from BreatheSafeAir.com
https://breathesafeair.com/temtop-s1-review/


